Two decades of peer-reviewed research, replication across national panels, and adoption by governments stand behind the method.
When an injury, illness, or wrongful act diminishes a person's quality of life, the law must translate that intangible loss into money. Courts have traditionally relied on medical bills, per-diem formulas, or jury intuition — methods with no scientific grounding for the experience of suffering itself. Over the past two decades, economists and psychologists have developed a rigorous alternative: measure how much a condition lowers a person's self-reported life satisfaction, then convert that drop into a monetary figure using an externally validated value per unit of well-being. This "well-being valuation" method rests on large national panel surveys, established welfare-economic theory, and measurement tools with documented reliability. This review sets out that evidence base for attorneys and courts.
Well-being valuation proceeds in two steps. First, using survey data linking people's circumstances to their reported life satisfaction (typically a 0–10 or 1–7 scale), a statistical model estimates how much a given event — bereavement, chronic pain, disability, job loss — lowers satisfaction, holding income and other factors constant. Second, that satisfaction loss is monetized. The foundational demonstration is Oswald & Powdthavee 2008, who used British and German panel data to estimate the fall in life satisfaction following the death of a spouse or child and derived the compensating income — the extra money that would restore the person's satisfaction to its prior level. Their paper, published in the Journal of Legal Studies, argued explicitly that such estimates could inform compensatory damages. The broader statistical apparatus for extracting these "shadow prices" from satisfaction data was formalized by van Praag & Ferrer-i-Carbonell 2004 in Happiness Quantified, and the method's contemporary policy form is codified in Frijters & Krekel 2021 and the life-course evidence synthesis of Clark et al. 2018.
The approach has been applied across many non-market goods: airport noise (van Praag & Baarsma 2004), the mental-health cost of financial loss (Gardner & Oswald 2007), the value of social relationships (Powdthavee 2008), and health conditions and disability (Powdthavee & van den Berg 2011). A recurring and legally salient finding is that people adapt only partially to serious adversity: Oswald & Powdthavee 2008b show that severe disability depresses life satisfaction durably, contradicting the assumption that claimants "get used to" injury.
The method is grounded in standard welfare economics. The monetary value of a loss is its compensating variation — the income change that leaves a person exactly as well off as before. In the well-being framework, life satisfaction proxies for experienced utility, so the compensating income for a bad event is recovered from the ratio of two regression coefficients: the effect of the event on satisfaction divided by the effect of income on satisfaction. The economic legitimacy of treating satisfaction scores as interpersonally informative utility data was argued by Kahneman & Krueger 2006, and the income–satisfaction relationship needed for the denominator was estimated directly by Layard, Mayraz & Nickell 2008.
The central methodological problem is that this income coefficient — the denominator — is small, imprecisely estimated, and vulnerable to bias, because income is measured with error and is correlated with unobserved traits. Dividing by a fragile denominator inflates and destabilizes the monetary estimate. The recommended solution is to not rely on the internal income coefficient at all, but to anchor the monetization on an external value per well-being-year. Powdthavee & van den Berg 2011 show that different instruments for income yield very different price tags for the same health condition, precisely because the marginal-rate-of-substitution approach is sensitive to how income is handled — motivating an external anchor instead. In current practice that anchor is the WELLBY (one point of life satisfaction for one year), valued using benchmarks derived from the value of a statistical life-year and QALY monetary thresholds. This external-anchor logic is the backbone of the appraisal frameworks discussed below and sidesteps the unstable denominator entirely.
Three lines of evidence support the method's robustness. First, the underlying regularities replicate across independent national panels: the satisfaction effects of unemployment, disability, bereavement, and income appear with consistent sign and comparable magnitude in the British (BHPS/UKHLS), German (SOEP), Australian (HILDA), and cross-national datasets synthesized by Clark et al. 2018. Ferrer-i-Carbonell & Frijters 2004 further show that the substantive conclusions are insensitive to whether satisfaction is treated as ordinal or cardinal and to the estimator used — a key robustness result, since it means the findings do not depend on a contestable scaling assumption. The comparison-income structure of well-being was independently confirmed by Ferrer-i-Carbonell 2005.
Second, modern robustness practices can be applied to any specific valuation. Specification-curve / multiverse analysis (Simonsohn, Simmons & Nelson 2020) reports the estimate across the full set of defensible model specifications rather than a single hand-picked one. Coefficient-stability diagnostics (Oster 2019) bound how much unobserved confounding would be needed to overturn a result, given how the coefficient moves as controls are added. E-values (VanderWeele & Ding 2017) quantify the minimum strength of an unmeasured confounder that could explain away an association. Together these convert "is this estimate robust?" from a rhetorical question into a reported number.
Third, the measures themselves are psychometrically validated. The Satisfaction With Life Scale (Diener et al. 1985) and single-item life-satisfaction questions show good reliability and construct validity (Diener, Inglehart & Tay 2013; Cheung & Lucas 2014). Krueger & Schkade 2008 found test–retest reliability around 0.5–0.7 — lower than a bathroom scale but comparable to many accepted psychological and economic measures, and high enough that group-level estimates (which is what valuation uses) are stable. Life-satisfaction data also predict objective outcomes including mortality (Steptoe, Deaton & Stone 2015), evidence the scores track something real rather than momentary mood.
Well-being valuation is no longer confined to academia — a point directly relevant to Daubert/Frye "general acceptance." The United Kingdom's official cost-benefit manual, HM Treasury's Green Book, now carries supplementary guidance endorsing the WELLBY approach for appraising policies whose main effects are on quality of life (HM Treasury 2021). National statistical offices collect subjective well-being at scale: the UK Office for National Statistics has asked four personal well-being questions of hundreds of thousands of residents annually since 2011, and the OECD 2013 issued international Guidelines on Measuring Subjective Well-being that standardize the instruments used by dozens of governments. New Zealand's Treasury built its Living Standards Framework and "Wellbeing Budget" (2019) around such measures, and the World Health Organization and OECD's How's Life? series treat subjective well-being as a headline indicator. This institutional uptake demonstrates that the measures and the valuation logic are accepted by mainstream official bodies, not a fringe technique.
For non-economic loss specifically, Oswald & Powdthavee 2008 remains the template: estimate the satisfaction loss from the injury, monetize with an external value per well-being-year, and present a defensible compensating figure. Legal scholars have argued for institutionalizing this: Bronsteen, Buccafusco & Masur 2013 propose "well-being analysis" as a replacement for both cost-benefit analysis and intuitive damage-setting, precisely because it captures hedonic and relational losses that dollar-denominated methods miss. Compared with the incumbents, the well-being method is theory-grounded where the multiplier method (a multiple of medical specials) has no basis in any model of welfare; it is calibrated to representative population data where per-diem and jury anchoring are ad hoc; and it accounts for partial adaptation and loss of life's enjoyment that medical bills ignore entirely.
Three objections recur. (1) Scale comparability — do a "6" and an "8" mean the same thing across people? The response is that group-average estimates are robust to individual scale heterogeneity, and conclusions survive ordinal treatment (Ferrer-i-Carbonell & Frijters 2004). (2) Reverse causation and confounding — unhappy people may earn less, biasing the income coefficient. This is exactly why the external-anchor (WELLBY) approach is preferred over the internal marginal-rate-of-substitution approach, and why Benjamin et al. 2014 caution that satisfaction data alone do not always recover true preferences; E-value and coefficient-stability diagnostics further bound any residual confounding. (3) The anchor's basis — the WELLBY value ultimately derives from value-of-statistical-life and QALY conventions that carry their own assumptions (Fabian & Pykett 2021); this is a transparent, auditable normative choice, stated openly rather than buried in an arbitrary multiplier. None of these critiques is unique to well-being valuation, and each is met with a documented, quantifiable safeguard — which is more than can be said for the methods it would replace.
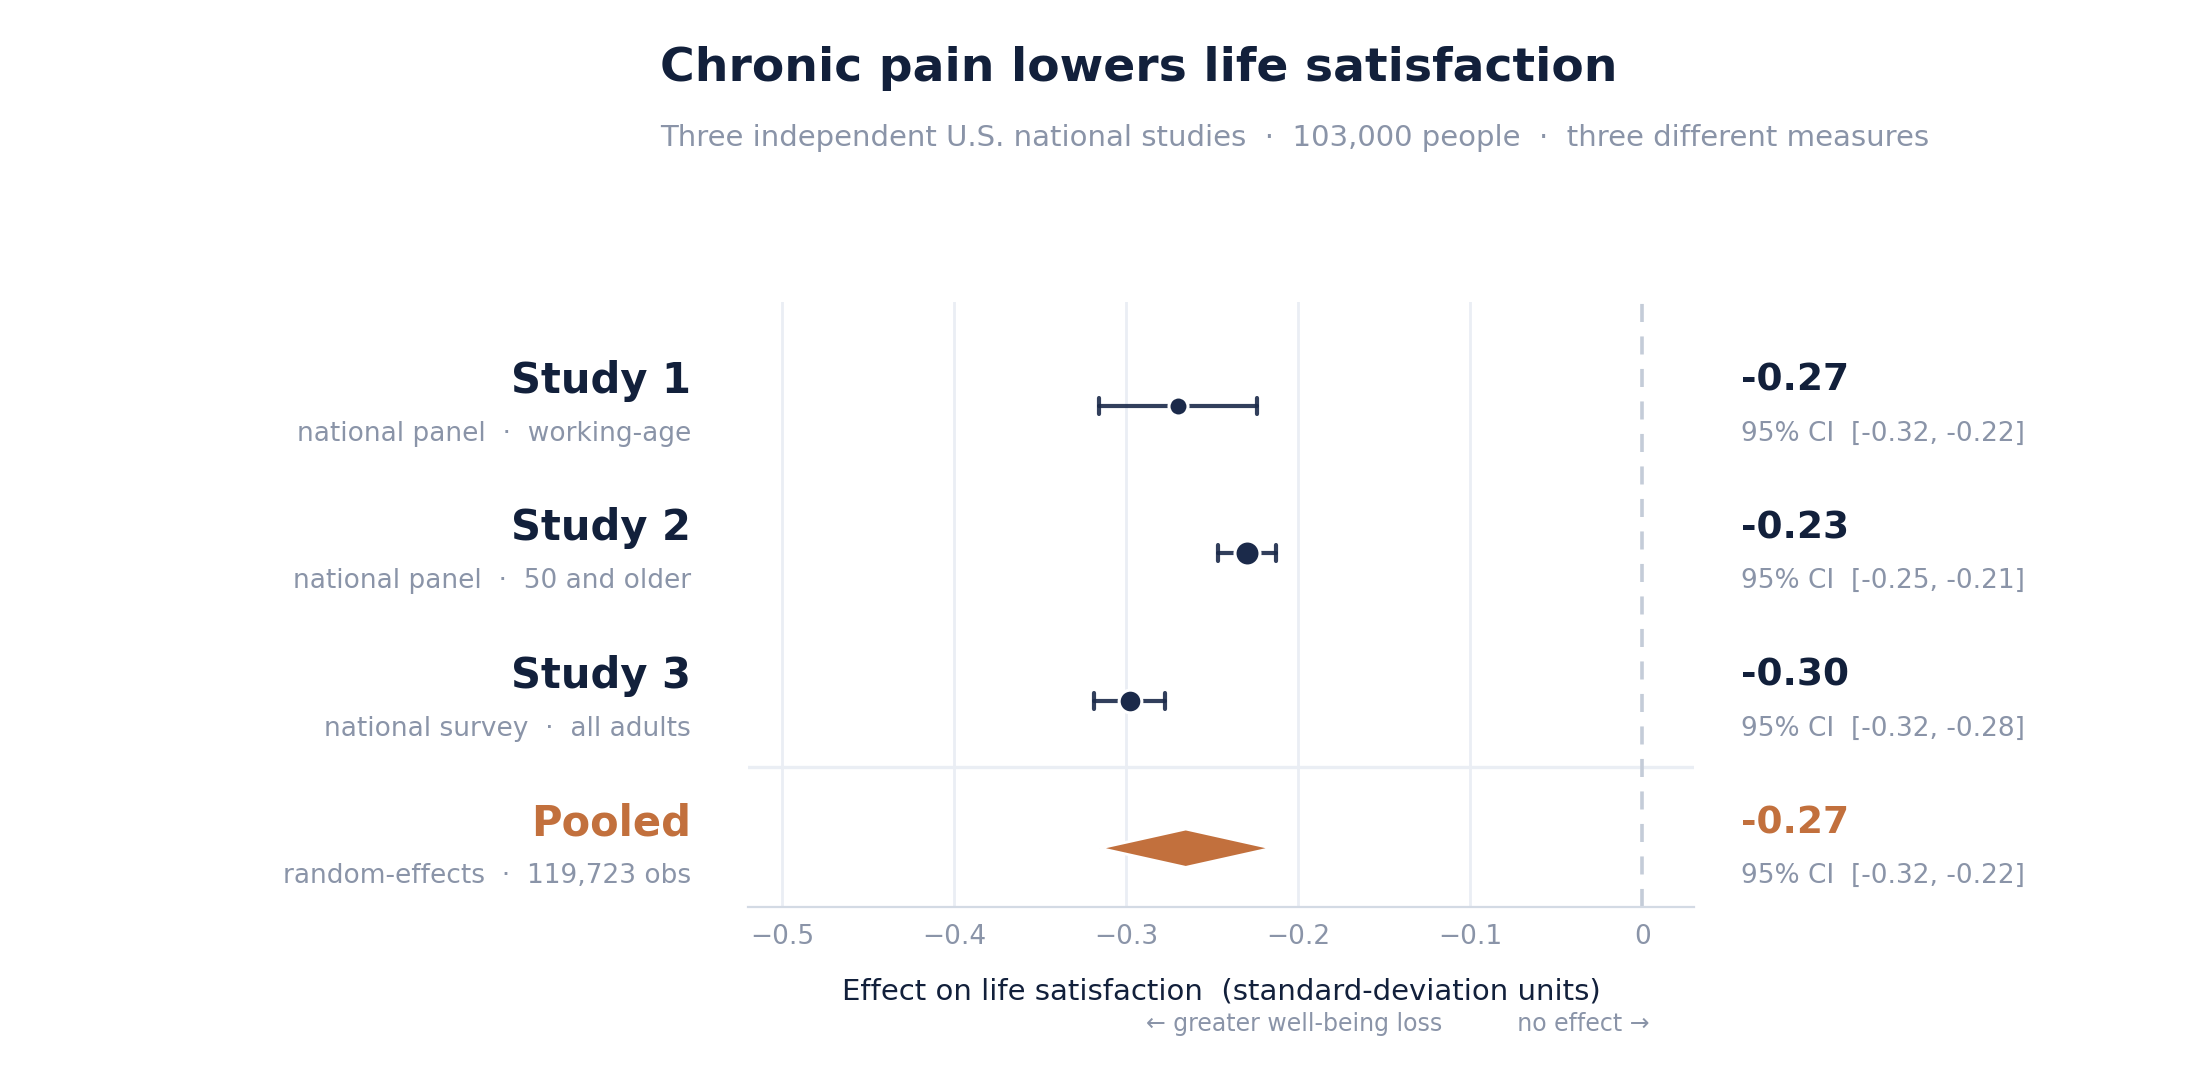
The published record above draws largely on British, German, and Australian panels. We asked whether the same result holds in the United States — estimating the effect of chronic pain on life satisfaction independently in three national U.S. datasets, using three different well-being measures across ages 18 to 90+. It does.